|
|
| (11 intermediate revisions by one user not shown) |
| Line 14: |
Line 14: |
| | | | |
| | | | |
| − | == Three Main End Point Deviations == | + | == Three Types of End Point Deviations == |
| | | | |
| | <table cellpadding=10> | | <table cellpadding=10> |
| | <tr valign=top> | | <tr valign=top> |
| − | <td width=800> | + | <td width=300> |
| | | | |
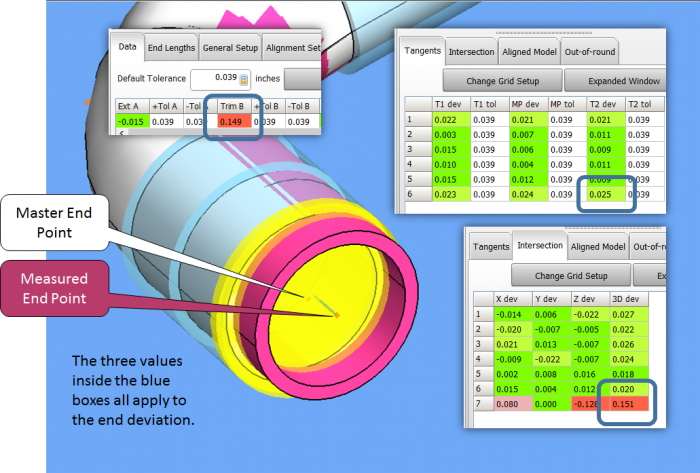
| − | There are three main end point deviation values calculated during an alignment of the MEASURED to the MASTER tube.<br><br> | + | There are three types of end point deviation values calculated during an alignment of the MEASURED to the MASTER tube.<br><br> |
| | </td> | | </td> |
| | <td width=700> | | <td width=700> |
| Line 28: |
Line 28: |
| | </table> | | </table> |
| | | | |
| | + | ====END LENGTH Deviations ==== |
| | <table cellpadding=10> | | <table cellpadding=10> |
| | <tr valign=top> | | <tr valign=top> |
| − | <td width=800> | + | <td width=300> |
| − | ====END LENGTH Deviations ====
| + | |
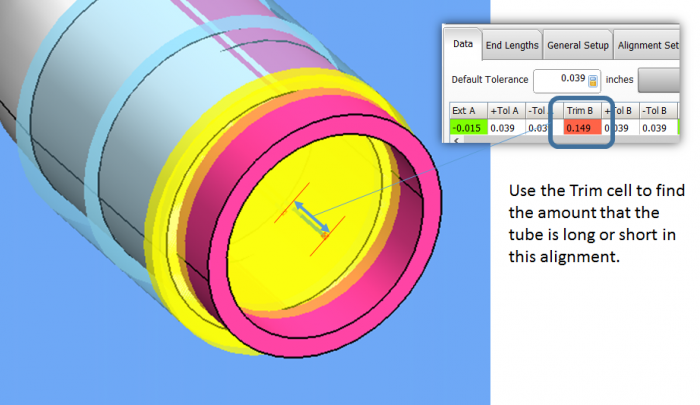
| | The end length deviations are found at the top of the Inspection menu. | | The end length deviations are found at the top of the Inspection menu. |
| | <br><br> | | <br><br> |
| Line 42: |
Line 42: |
| | </table> | | </table> |
| | | | |
| − | <br><br>
| + | ====AFTER-TRIM Deviations ==== |
| − | | + | |
| − | == Tangent Point Deviations in the Inspection Data Grid == | + | |
| − | | + | |
| | <table cellpadding=10> | | <table cellpadding=10> |
| | <tr valign=top> | | <tr valign=top> |
| − | <td width=500> | + | <td width=300> |
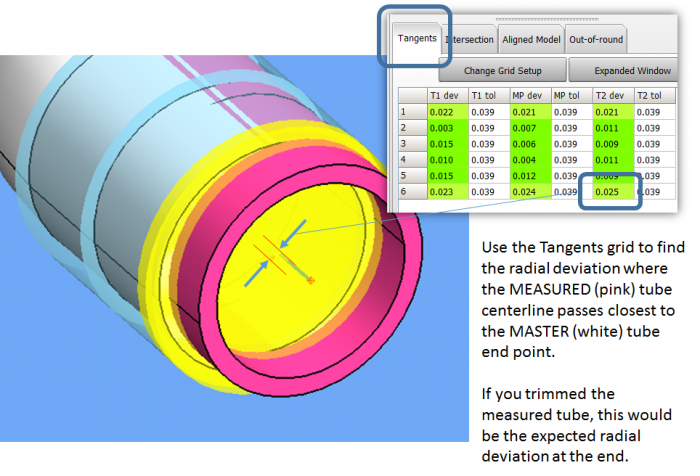
| − | | + | These are found in the first T1 value and the last T2 value in the Tangents grid. |
| − | The Tangent chart is represented by a grid of straights for each row with tangent points and midpoints for each straight:<br><br>
| + | |
| − | | + | |
| − | * T1 = Tangent 1 Deviation
| + | |
| − | * MP = Midpoint Deviation
| + | |
| − | * T2 = Tangent 2 Deviation<br><br>
| + | |
| − | * T1t = Tangent 1 Deviation Tolerance
| + | |
| − | * MPt = Midpoint Deviation Tolerance
| + | |
| − | * T2t = Tangent 2 Deviation Tolerance
| + | |
| − | | + | |
| − | | + | |
| | <br><br> | | <br><br> |
| − | | + | These deviations show the expected radial deviation if the tube were trimmed. |
| − | Note that the two end points are also included in the tangent charts are reports (T1d in straight 1, and T2d in the last straight). They are an exception to the technical tangent definition given above because there is no bend attached to these points. But these points still have value in determining if the part is the correct shape, so it is convenient to include them in this chart and grid - even though they are not really tangents.<br><br>
| + | |
| − | | + | |
| − | Midpoint deviations are always less than the highest corresponding tangent deviation, and higher than the lowest corresponding tangent deviation. They are included in traditional reports so that you can have three separate deviation tolerances in a straight. (T1-MP-T2)
| + | |
| − | | + | |
| − | | + | |
| | </td> | | </td> |
| − | <td width=300> | + | <td width=700> |
| − | [[image:vtube-laser_v2.7_tangentpoint_deviations.png|500px]]<br><br> | + | [[image:vtl after-trim deviations.png|700px]] |
| − | | + | |
| | </td> | | </td> |
| | </tr> | | </tr> |
| | </table> | | </table> |
| − |
| |
| − | ==The Same Data In Reports==
| |
| | | | |
| | | | |
| | + | ====3D Length Deviations ==== |
| | <table cellpadding=10> | | <table cellpadding=10> |
| | <tr valign=top> | | <tr valign=top> |
| − | <td width=500>
| |
| − | The same tangent data can be shown in the reports like this.<br><br>
| |
| − | Some customers prefer to modify the report to show only their critical data. For example, they may remove the midpoints or the end angles from the reports(which can be done by changing the report templates).<br><br>
| |
| − | (For those with active [[VTube Software Maintenance Plan]]s: We are happy to help you modify the report templates if you request it.)
| |
| − |
| |
| − | </td>
| |
| | <td width=300> | | <td width=300> |
| − | [[image:vtube-laser-tangent-report.png|500px]]
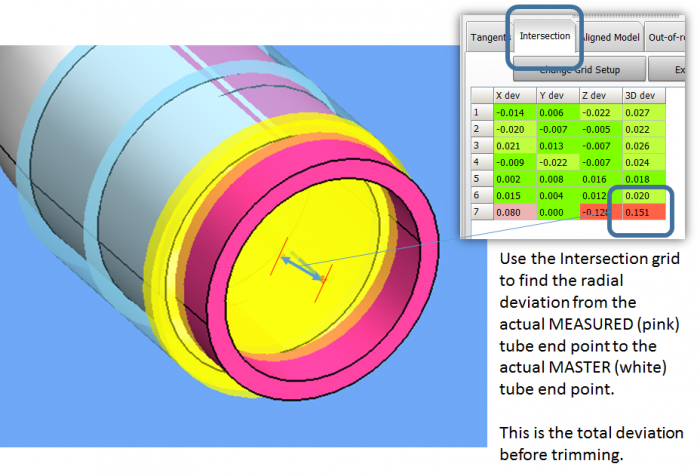
| + | These are found in the Intersection grid values. |
| | + | <br><br> |
| | + | The 3D deviations represent for the first and the last points represent the total radial deviation between the MASTER and the MEASURED end points in this alignment orientation. |
| | </td> | | </td> |
| − | </tr>
| + | <td width=700> |
| − | </table>
| + | [[image:vtl before-trim deviations.png|700px]] |
| − | | + | |
| − | == How to Understand the Tangent Data ==
| + | |
| − | | + | |
| − | <table cellpadding=10>
| + | |
| − | <tr valign=top>
| + | |
| − | <td width=500> | + | |
| − | | + | |
| − | The image on the right shows the visual representation of the chart and report above. The deviations in the grid match the part in the image. The part is made transparent so that you can see the two centerlines inside the tube. (It's easy to make parts transparent by setting the transparency value about 0.75 inside the Parametric Tube control menu under Models.)<br><br>
| + | |
| − | | + | |
| − | In the image below shows how the distance T1d is measured in the second straight:<br>
| + | |
| − | [[image:vtube-laser-t1d-illustrated.png|500px]] | + | |
| − | | + | |
| − | <br>
| + | |
| − | In this case, the T1d value is 0.9mm for straight 2.
| + | |
| − | </td>
| + | |
| − | <td width=300>
| + | |
| − | [[image:vtube-laser-t1d-mp-t2d-image1.png|500px]]
| + | |
| | </td> | | </td> |
| | </tr> | | </tr> |
| | </table> | | </table> |
| | | | |
| − | == How to Understand the End Point Deviations ==
| |
| | | | |
| − | ===Automatic Internal Trimming of End Points for Shape===
| + | <br><br> |
| − | <table cellpadding=10>
| + | |
| − | <tr valign=top>
| + | |
| − | <td width=500>
| + | |
| − | Even though the end points are not tangents, we can still use them in the chart because they qualify the part the same way that tangent points do.<br><br>
| + | |
| − | A key in understanding the T1d of straight one and the T2d of the last straight is to remember that the deviation is not the same as how long or short the straights are relative to the master tube shape. See the illustration on the right to understand why.<br><br>
| + | |
| − | The MASTER to MEASURED end point deviation in the Tangent grid is 1.9mm. The measurement is the distance between the two lines at the corresponding end points - as if the MEASURED WERE TRIMMED.<br><br>
| + | |
| − | (The Measured part is the pink part. The Master part is white.)
| + | |
| − | </td>
| + | |
| − | <td width=300>
| + | |
| − | [[image:vtube-laser-t1d-end1.png|500px]]
| + | |
| − | </td>
| + | |
| − | </tr>
| + | |
| − | </table>
| + | |
| − | | + | |
| − | ===Untrimmed End Points for Lengths===
| + | |
| − | <table cellpadding=10>
| + | |
| − | <tr valign=top>
| + | |
| − | <td width=500>
| + | |
| − | However, the end length is 90.2mm too long.<br><br>
| + | |
| − | | + | |
| − | In this application, the customer bent the part 90mm too long on purpose in order to give the bend arm clamp die enough material on the first straight to grip.<br><br>
| + | |
| − | | + | |
| − | Notice that, even though the part is significantly too long, the BEST FIT algorithm didn't use the actual measured end point in the alignment. The alignment was based on the trimmed point on the measured centerline that was nearest the master end point.<br><br>
| + | |
| − | | + | |
| − | So, in this case the part shape in space is qualified - but it needs trimming by 90.2mm to also qualify the end length (another critical qualifier).
| + | |
| − | | + | |
| − | </td>
| + | |
| − | <td width=300>
| + | |
| − | [[image:vtube-laser-endlength.png|500px]]
| + | |
| − | </td>
| + | |
| − | </tr>
| + | |
| − | </table>
| + | |
| − | | + | |
| − | | + | |
| − | =Typical Industry Tangent Point Tolerances=
| + | |
| − | <table cellpadding=10>
| + | |
| − | <tr valign=top>
| + | |
| − | <td width=500>
| + | |
| − | In working with thousands of customers over the past few decades, we've seen some trends in accepted envelope deviation tolerances. Here are what we commonly see:
| + | |
| − | | + | |
| − | ====Aerospace and Automative Fluid Lines====
| + | |
| − | <table cellpadding=10 width=400>
| + | |
| − | <tr>
| + | |
| − | <td bgcolor=#9999CC>
| + | |
| − | Diameter Range
| + | |
| − | </td>
| + | |
| − | <td bgcolor=#CCCCFF width=200>
| + | |
| − | Envelope Tolerance
| + | |
| − | </td>
| + | |
| − | </tr>
| + | |
| − | | + | |
| − | <tr>
| + | |
| − | <td>
| + | |
| − | 12.7 mm (0.5 inch) diameter tubes or less
| + | |
| − | </td>
| + | |
| − | <td>
| + | |
| − | +/- 1 mm (0.039 inches)
| + | |
| − | </td>
| + | |
| − | </tr>
| + | |
| − | | + | |
| − | <tr>
| + | |
| − | <td>
| + | |
| − | Greater than 12.7 mm (0.5 inch)
| + | |
| − | </td>
| + | |
| − | <td>
| + | |
| − | +/- 2 mm (0.078 inches)
| + | |
| − | </td>
| + | |
| − | </tr>
| + | |
| − | | + | |
| − | </table>
| + | |
| − | | + | |
| − | ====Automotive Exhaust Pipes====
| + | |
| − | <table cellpadding=10 width=400>
| + | |
| − | <tr>
| + | |
| − | <td bgcolor=#9999CC>
| + | |
| − | Diameter Range
| + | |
| − | </td>
| + | |
| − | <td bgcolor=#CCCCFF width=200>
| + | |
| − | Envelope Tolerance
| + | |
| − | </td>
| + | |
| − | </tr>
| + | |
| − | | + | |
| − | <tr>
| + | |
| − | <td>
| + | |
| − | 50 mm to 76 mm
| + | |
| − | </td>
| + | |
| − | <td>
| + | |
| − | From +/- 2 mm to +/- 3 mm
| + | |
| − | </td>
| + | |
| − | </tr>
| + | |
| − | | + | |
| − | <tr>
| + | |
| − | <td>
| + | |
| − | 76 mm to 102 mm
| + | |
| − | </td>
| + | |
| − | <td>
| + | |
| − | +/- 3 mm
| + | |
| − | </td>
| + | |
| − | </tr>
| + | |
| − | | + | |
| − | <tr>
| + | |
| − | <td>
| + | |
| − | Larger then 102 mm
| + | |
| − | </td>
| + | |
| − | <td>
| + | |
| − | +/- 3 mm or greater
| + | |
| − | </td>
| + | |
| − | </tr>
| + | |
| − | | + | |
| − | </table>
| + | |
| − | | + | |
| − | ====Shipbuilding====
| + | |
| − | <table cellpadding=10 width=400>
| + | |
| − | <tr>
| + | |
| − | <td bgcolor=#9999CC>
| + | |
| − | Diameter Range
| + | |
| − | </td>
| + | |
| − | <td bgcolor=#CCCCFF width=200>
| + | |
| − | Envelope Tolerance
| + | |
| − | </td>
| + | |
| − | </tr>
| + | |
| − | | + | |
| − | <tr>
| + | |
| − | <td>
| + | |
| − | All Diameters
| + | |
| − | </td>
| + | |
| − | <td>
| + | |
| − | +/- 6 mm
| + | |
| − | </td>
| + | |
| − | </tr>
| + | |
| − | | + | |
| − | </table>
| + | |
| − | | + | |
| − | | + | |
| − | ====HVAC====
| + | |
| − | <table cellpadding=10 width=400>
| + | |
| − | <tr>
| + | |
| − | <td bgcolor=#9999CC>
| + | |
| − | Diameter Range
| + | |
| − | </td>
| + | |
| − | <td bgcolor=#CCCCFF width=200>
| + | |
| − | Envelope Tolerance
| + | |
| − | </td>
| + | |
| − | </tr>
| + | |
| − | | + | |
| − | <tr>
| + | |
| − | <td>
| + | |
| − | All Diameters
| + | |
| − | </td>
| + | |
| − | <td>
| + | |
| − | +/- 2 to +/- 3 mm
| + | |
| − | </td>
| + | |
| − | </tr>
| + | |
| − | | + | |
| − | </table>
| + | |
| − | | + | |
| − | ====Structural Tubes (Frames)====
| + | |
| − | <table cellpadding=10 width=400>
| + | |
| − | <tr>
| + | |
| − | <td bgcolor=#9999CC>
| + | |
| − | Diameter Range
| + | |
| − | </td>
| + | |
| − | <td bgcolor=#CCCCFF width=200>
| + | |
| − | Envelope Tolerance
| + | |
| − | </td>
| + | |
| − | </tr>
| + | |
| − | | + | |
| − | <tr>
| + | |
| − | <td>
| + | |
| − | All Diameters
| + | |
| − | </td>
| + | |
| − | <td>
| + | |
| − | +/- 2 to +/- 3 mm
| + | |
| − | </td>
| + | |
| − | </tr>
| + | |
| − | | + | |
| − | </table>
| + | |
| − | | + | |
| − | ====Tighter Tolerances====
| + | |
| − | | + | |
| − | Sometimes customers will required +/-0.75 mm - but this is very rare. We've never seen tube shapes that must be qualified with a deviation tolerance of less than +/- 0.75 mm.
| + | |
| − | | + | |
| − | </td>
| + | |
| − | <td width=300>
| + | |
| − | [[image:aerospace_envelope_tolerance.png|400px]]<br>
| + | |
| − | [[image:exhaust_envelope_tolerance.png|400px]]<br>
| + | |
| − | [[image:shipbuilding_envelope_tolerance.png|400px]]<br>
| + | |
| − | </td>
| + | |
| − | </tr>
| + | |
| − | </table>
| + | |
| | | | |
| | =Other Pages= | | =Other Pages= |
| | | | |
| | * See also [[VTube Intersection Point Tolerances]] | | * See also [[VTube Intersection Point Tolerances]] |
| | + | * [[What are Centerline Tangent Points and Why Are They Important in VTube-LASER?]] |
| | + | * About [[VTube Intersection Point Tolerances]] |
| | + | * About [[VTube End Length Offsets]] |
| | + | * [[The Limitations of Qualifying Tube Shapes using Bender Data]] |
| | * Back to [[VTube-LASER]] | | * Back to [[VTube-LASER]] |
