Sigma
|
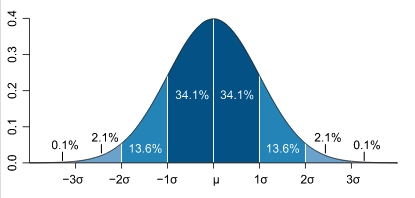
Most have heard of the "bell curve" in mathematics. This is the shape that describes the probability that a given percentage of measurements will fall within a certain region under a standard bell curve. This shape is found in nature - so its one that mathematicians use often. This shape of the standard bell curve is called "Normal Distribution" or "Gausian Distribution." |
HOW SIGMA PERTAINS to the BELL CURVE
A statistical measurement called "standard deviation" is also referred to as "sigma" on the horizontal axis of a bell curve. Basically, this is a measurement of how much the measurements vary around the actual value between the sigma line on the right and the sigma line on the left.
If someone says that the the probability that a measurement will fall within 1 sigma, then that person is referring to the width that is formed by the standard deviation.
Now three sigma is 3* the standard deviation, which statistically mean that 99.73% of the time a measurement is made it will be within 3*the standard deviation of the actual value. It is thus a way to compare how good the measurement method is.
In similar ways 2 sigma means within 95% of the actual value and 6 sigma means as close to always as is resonable to ever need.
